My friend Vincenzo recently posted up a review of academic work on clustering that he compiled while working at the University of Naples. It's worth a look if you're interested in the field, going from the basic methods all the way up to the latest techniques like Support Vector Clustering (which I believe you can read about in Enzo's masters thesis).
Clustering, for those who haven't encountered it, refers to partitioning some data into a number of groups, or clusters. It's an unsupervised technique, unlike classification, as there aren't any examples to learn which groups different types of data should go into. The ideal algorithms even attempt to work out how many groups there should be, but for a lot of the simpler techniques the number of clusters is an input parameter.
This can be useful for all sort of reasons, but one particular example Vincenzo gives is for guiding searches - for example a search for 'tiger' might give results as on a regular page, but also offer refinements for Tiger Woods, the tiger the animal, or the version of Mac OSX; allowing searchers to focus their queries on some particular grouping of results.
Probably the simplest method is the K-Means algorithm, which places k points in the data space then progressively averages them with the items around them. This is a flat clustering technique - there's no relationship between the clusters, as opposed to (more advanced) hierarchical clustering algorithms. Below I've knocked up a brief implementation (download the whole source here), though for the example rather than using a whole document vector (a series of values that represents a document based on the words it contain) as you would for a real search engine, we have a set of simple 2 dimensional points.
<?php
$data = array(
array(0.05, 0.95),
array(0.1, 0.9),
array(0.2, 0.8),
array(0.25, 0.75),
array(0.45, 0.55),
array(0.5, 0.5),
array(0.55, 0.45),
array(0.85, 0.15),
array(0.9, 0.1),
array(0.95, 0.05)
);
?>
Our first step is to randomly initialise the points around which we will cluster, referred to as the centroids. We try to stay inside the bounds of the data, as we know our points are going to be at the center of a circle, so we limit the rand function with the min and max. The function takes the data to cluster, formatted as above (though with any number of entries), and a value k to represent the number of clusters we want.
<?php
function initialiseCentroids(array $data, $k) {
$dimensions = count($data[0]);
$centroids = array();
$dimmax = array();
$dimmin = array();
foreach($data as $document) {
foreach($document as $dimension => $val) {
if(!isset($dimmax[$dimension]) || $val > $dimmax[$dimension]) {
$dimmax[$dimension] = $val;
}
if(!isset($dimmin[$dimension]) || $val < $dimmin[$dimension]) {
$dimmin[$dimension] = $val;
}
}
}
for($i = 0; $i < $k; $i++) {
$centroids[$i] = initialiseCentroid($dimensions, $dimmax, $dimmin);
}
return $centroids;
}
function initialiseCentroid($dimensions, $dimmax, $dimmin) {
$total = 0;
$centroid = array();
for($j = 0; $j < $dimensions; $j++) {
$centroid[$j] = (rand($dimmin[$j] * 1000, $dimmax[$j] * 1000));
$total += $centroid[$j]*$centroid[$j];
}
$centroid = normaliseValue($centroid, sqrt($total));
return $centroid;
}
/* We're expecting normalised docs */
function normaliseValue(array $vector, $total) {
foreach($vector as &value) {
$value = $value/$total;
}
return $vector;
}
?>
Once we have our starting points we can then look at the main meat of the algorithm, the loop of iteratively moving and testing the centroids to find those that fit the data.
<?php
function kMeans($data, $k) {
$centroids = initialiseCentroids($data, $k);
$mapping = array();
while(true) {
$new_mapping = assignCentroids($data, $centroids);
$changed = false;
foreach($new_mapping as $documentID => $centroidID) {
if(!isset($mapping[$documentID]) ||
$centroidID != $mapping[$documentID]) {
$mapping = $new_mapping;
$changed = true;
break;
}
if(!$changed){
return formatResults($mapping, $data);
}
$centroids = updateCentroids($mapping, $data, $k);
}
}
// just a function to tidy the results up
function formatResults($mapping, $data) {
$result = array();
foreach($mapping as $documentID => $centroidID) {
$result[$centroidID][] = implode(',', $data[$documentID]);
}
return $result;
}
?>
The two new functions referenced in the main loop are assignCentroids, and updateCentroids. The first just takes the current centroids and maps data to the closest one, using the absolute distance between them. This is also our stopping condition - if no data swap clusters in an iteration, we assume we're done and exit.
<?php
function assignCentroids($data, $centroids) {
$mapping = array();
foreach($data as $documentID => $document) {
$minDist = null;
$minCentroid = null;
foreach($centroids as $centroidID => $centroid) {
$dist = 0;
foreach($centroid as $dim => $value) {
$dist += abs($value - $document[$dim]);
}
if(is_null($minDist) || $dist < $minDist) {
$minDist = $dist;
$minCentroid = $centroidID;
}
}
$mapping[$documentID] = $minCentroid;
}
return $mapping;
}
?>
The second function, updateCentroids, just moves the centroid to the average of all the points that are 'assigned' to it. If we end up with an unassigned centroid, we simply generate some new random coordinates for it so it goes back into the pool.
<?php
function updateCentroids($mapping, $data, $k) {
$centroids = array();
$counts = array_count_values($mapping);
foreach($mapping as $documentID => $centroidID) {
foreach($data[$documentID] as $dim => $value) {
$centroids[$centroidID][$dim] += ($value/$counts[$centroidID]);
}
}
if(count($centroids) < $k) {
$centroids = array_merge($centroids,
initialiseCentroids($data, $k - count($centroids)));
}
return $centroids;
}
?>
Running the whole thing gives us the following output (or a var_dump on it does anyway):
<?php
array(3) {
[0]=>
array(4) {
[0]=>
string(9) "0.05,0.95"
[1]=>
string(7) "0.1,0.9"
[2]=>
string(7) "0.2,0.8"
[3]=>
string(9) "0.25,0.75"
}
[2]=>
array(3) {
[0]=>
string(9) "0.45,0.55"
[1]=>
string(7) "0.5,0.5"
[2]=>
string(9) "0.55,0.45"
}
[1]=>
array(3) {
[0]=>
string(9) "0.85,0.15"
[1]=>
string(7) "0.9,0.1"
[2]=>
string(9) "0.95,0.05"
}
}
?>
The centroids, and the natural clustering of the data, is a bit easier to see on a chart:

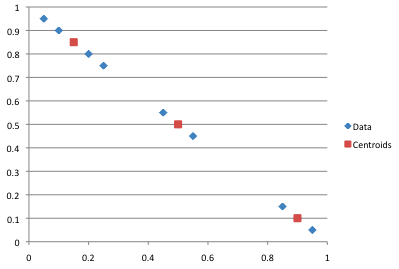
You can see in the output array that the data has clustered as we'd expect it to, but that is in part because of the random starting positions that were chosen. If they had been slightly different we might have ended up with a different partitioning of the data, one which may be less optimal. It we were being clever we could use a mix of random and intentional points - place one random, one as far away from it as possible, the next as far away as possible from that one, and so on. This can be a bit of an effort if you've got a lot of dimensions, but will likely result in a more reliable algorithm.
heinz
September 26th, 2009 at 09:54
A nice tutorial, but you forgot to define the function 'normaliseValue'.
Perhaps you may provide the whole code for downloading.
Text Classification (And Twitter) - PHP/ir
September 29th, 2009 at 10:14
... assigning items, usually documents of one form or another, to groups from a predefined set. Unlike clustering the groups are (usually) known before hand, and rather than attempting to work out the groupings by...
[Ian Barber]Text Classification (And Twitter) – techPortal
September 30th, 2009 at 14:01
... assigning items, usually documents of one form or another, to groups from a predefined set. Unlike clustering the groups are (usually) known before hand, and rather than attempting to work out the groupings by...
nop
October 18th, 2009 at 06:12
It seems that the definition of normaliseValue function is missing. Is it possible to add it?
Ian Barber
December 2nd, 2009 at 10:12
Sorry, should have posted the whole thing really. Added now.
I zipped the code up and stuck it here: http://phpir.com/user/files/cluster.zip
darliza
February 11th, 2010 at 10:30
hi. is the chart included in the code? thanks
darliza
February 11th, 2010 at 10:30
and if it isn't, where can i get it? thanks! :D
Ian Barber
February 25th, 2010 at 10:35
I just made it in a spreadsheet by pasting in the results actually, no code involved I'm afraid. There's plenty of charting APIs out there that could do the job though.
leadingsire
March 4th, 2010 at 18:14
Hi there, just curious one thing:
Is this method adaptable to more 2 dimensional points?
original:
$data = array( array(0.05, 0.95), ...)
After:
$data = array( array(13, 0.05, 0.95, 0.2), ...)
I have tested it with 4 dimentional points, but seems the k-means clustering just based on and stressed on the "first dimension" and ignore the value of other dimentions...
Could you please advice?
Thanks!
Ian Barber
March 6th, 2010 at 21:20
Leadingsire: yeah, there was a bit of a bug in the k-means function so that it would exit as soon as there were no changes seen in the first dimension only! That's fixed now though, so you should be OK with your example.
anggie
March 28th, 2010 at 05:56
iI need information about the document clustering with k-means method for my final assignment .if anyone can help. send me your answer to my email : nggie.ninggar@yahoo.com
thanks :)
Anonymous Yet Interested Reader
August 19th, 2010 at 22:58
Hi,
In your downloadable code sample, you normalize by the magnitude of the vector (sum of the squares of its elements). Why? This seems as if it would treat values of (1,1) and (5,5) as the same. Wouldn't this be clustering the angle of the vector rather than the components of it?
I've seen normalization done across a metric, such as normalize all the $d[0] values by the max($d[0]), and normalize all the $d[1] values by max($d[1]).
This would let you handle data that varies across different scales, such as age vs salary.
Or maybe I'm mistaken here? I'd love to hear your thoughts on this.
Also, there's a lot of looping in your PHP. I'll bet, through clever use of array_map and similar functions, you could make your code a lot faster for larger data sets. You could also initialize some of your arrays, which would eliminate some warnings produced when running PHP in stricter modes (though the array_map usage might eliminate much of that need altogether). Then again, I realize you wrote it this way to make things more educational to your readers....
This is a great post (and a great blog). Keep up the great work!
Ian
September 26th, 2010 at 20:43
Hi Anon, yeah, this is indeed clustering the angle of the vector - the reason for that is that (while not exclusively used for this), the use case I had in mind was text clustering, and usually in that situation you're working in a high dimensionality space with a lot of variable length documents, so normalising means your comparison is cosine similarity. However, it's a fair point that not normalising may in fact yield better results depending on the data set!
Absolutely right regarding the looping, there are certainly more optimal ways of handling data, particularly when dealing with large amounts of data.
Thanks for the comment!
khaled
January 17th, 2011 at 18:47
Hello
How to apply this script to a database of documents like reuters news for exemple to determine the clusters??
Ian Barber
January 17th, 2011 at 21:38
Hi Khaled. You'd need to turn your documents into vectors, using something like tf-idf to calculate the values, and treating each term as a dimension. Things are likely to get a bit hairy if you have too many dimensions, so I'd suggest trying to collapse them as much as possible - use stemming, and maybe cut out very common and very uncommon words, or similar.
khaled
January 17th, 2011 at 22:13
assuming your $data exemple, how i transform my documents into array like $data?
i have in my database a table with 45000 keywords present in 4000 document and another table withe the relation between keywords and documents with pre-calculated weight?
I can also calculate a tf-idf but i don't understand how i transform this data into a $data like array??
an exemple will be great
thank you Ian
arshia
May 29th, 2011 at 09:35
hey Ian, plz answer khaled's querry...
even i need to know how to represent text documents in the form of coordinates... as in to calculate the interdocument similarity , each document has obviously more than 2 keywords..so the dimensions would be more than 2.. plz tell how can we represent... wud be better if u can give a little bit of code for the same..or an example wud also do..
thanx ian.
Ian Barber
June 15th, 2011 at 15:11
Hi Khaled, Arshia, take a look at my article on vector space search for how it works: http://phpir.com/simple-search-the-vector-space-model
Gaban_jiddan
April 12th, 2012 at 01:25
Hi Ian Barber im working on text clustering and i have a question. is that we used vsm inside clustering algorithm or both are separate..1 more help do you acknowledged clustering hierarchical agglomerative using php programming..hope u can help me thanks in advance.
Ian Barber
April 12th, 2012 at 07:45
Hi Gaban. You can use SVM as part of a clustering algo - google support vector clustering (or take a look at the code Vincenzo did for his thesis; http://neminis.org/software/support-vector-clustering/)
Hierarchical clustering is a great method, easy to implement and lots of use cases. I don't think I've got a blog post on it, but it's certainly a good idea.
What to use depends in a large part of the type of problem, and the flexibility you need. One advantage of the agglomerative cluster is that it gives you the option of viewing the data at different depths - which can map straight onto real world uses like putting flags on a online maps product for example.
Lee Davis
June 8th, 2012 at 16:08
Hi Ian,
Great article.
Was thinking about the way you're randomly initialising a centroid between the min/max dimension space.
Would it not be beneficial to instead just randomly allocate it to the position of one of your data points?
I can certainly see how this may reduce the computational cost, just wondered if you had any idea on what effects it might have on the end result.
Also, do you have ideas on mechanisms to help determine an appropriate number of groups ($k). Rather than re-initialising centroids when they become unassigned, would dropping them all together be a better idea?
Ian Barber
June 8th, 2012 at 17:30
Hi Lee, allocating to a point is pretty reasonable, I've done that and it's worked pretty well, but it depends on the natural spread of the data - if you have some outliers, in some cases you'd like those to be more likely to be in their own group, in others combined into more general groups, and the different strategies will effect the likelihood of that to a degree.
Dropping rather than reiniting is an interesting idea - again it's going to depend a little on the luck of where the first one's get allocated to, but might work. In the past, where it's been reasonable to do several runs I have simply tried a range of different Ks automatically, and checked the results for quality of fit - usually you're clustering to feed into another system of some kind, so you can test against that one. You might do better with some kind of heirarchical clustering if you're looking at that though, as it lets you move up and down the levels of grouping a little more flexibly.
Arjun
June 9th, 2012 at 13:26
Hi Ian,
Nice Article !
I wanted to ask you using your existing code, how do we use it with Training and Testing data. What I mean is something like- I give a corpus or dataset of documents to train the classifier and save the trained model. Later on if I have a new text document then I can pass it through my model and find out which cluster it is classified to.. saving the trained model and passing a new text to this model will help me save time by avoiding re-running the whole code from scratch.. right ??
Ian Barber
June 12th, 2012 at 13:13
Arjun: right, but it's not a "train" and "test" set - you're using clustering to generate a model, then you're classifying against that model.
yeppy guy
June 29th, 2012 at 15:57
can the above kmeans be applied on the score of the vector space model and cluster the search results in runtime
please let me know way to do it